


Zabbix is a widely-used open-source monitoring software for tracking and managing IT infrastructure. This article helps you understand its features, pros, cons, and core components.
High-Speed Proxy - Ready to Try?
ALGO Proxy offers residential, datacenter & 4G proxies in 195+ countries
What is Zabbix?
Zabbix is a dedicated open-source tool for monitoring and managing systems, network devices, and applications. First developed in 2001 by Alexei Vladishev, Zabbix provides a comprehensive solution that helps enterprises monitor status, performance, and receive alerts from their systems.
With Zabbix, users can monitor various types of devices and services: servers, databases, operating systems, and specific applications. Zabbix's strengths lie in its high scalability and customizability, user-friendly web interface, and support for notifications via email, SMS, Slack, and Telegram.
Key Functions of Zabbix
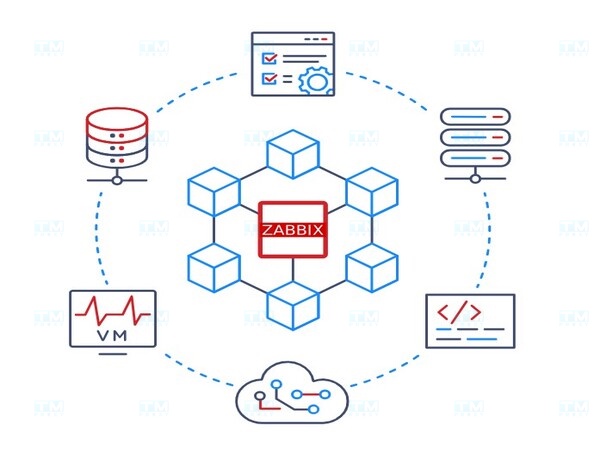
Comprehensive Monitoring: Zabbix tracks the status of network devices, servers, databases, and applications across multiple platforms (Linux, Windows, VMware, Docker, AWS, Azure). Administrators can set up custom performance metrics and receive instant alerts when issues occur.
Network Traffic Analysis: Zabbix monitors data packets, evaluates bandwidth, detects network congestion or abnormal behavior — particularly useful for complex network systems.
Notable Features
- Visualization: Charts, graphs, and status maps for visual performance metric tracking.
- Problem Detection: Early detection of performance, resource, hardware, and software issues.
- Notification and Remediation: Notifications via email, SMS, Slack, Telegram and automatic issue remediation.
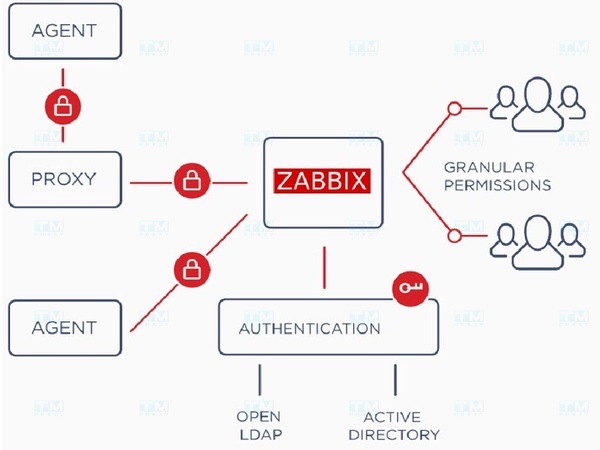
- Security and Authentication: User access control, data encryption, 2FA, LDAP, and Active Directory integration.
- Metric Collection: Data collection from servers, network devices, databases, and cloud services.
- Auto-Discovery: Automatic detection of new devices on the network and adding them to the monitoring list.
- Zabbix API: Powerful API for third-party application integration and management automation.
Key Characteristics of Zabbix
Comprehensive Monitoring: Supports physical, virtualized, cloud, and hybrid environments. Monitors HTTP, FTP, SMTP, and specialized applications.
Real-time Monitoring: Alerts are sent immediately when issues are detected or thresholds are exceeded.
Reports and Visual Charts: Customizable dashboards, charts, and graphs for quick data analysis.
Diverse Integration: Jenkins, Ansible, Nagios, Grafana, and many other DevOps/ITSM tools through API.
Strong Community: Large user community, official technical support, consulting, and training.
Advantages of Zabbix
- Free and Open Source: No licensing costs, especially suitable for small and medium businesses.
- Diverse Monitoring: Supports Linux, Windows, macOS, Routers, Switches, applications, virtual machines, and cloud services.
- Excellent Scalability: Suitable from small systems to thousands of devices.
- Intuitive Interface: Customizable dashboards, charts, and easy-to-use reports.
- Multi-channel Alerting: Email, SMS, Telegram, Slack, and messaging app integration.
- High Customizability: Integration with many tools, customizable alerts and reports.
- Strong Community Support: Extensive documentation, forums, and resources.
Disadvantages of Zabbix
- Complex Configuration: Many configuration options require advanced technical knowledge, especially for beginners.
- High System Resources: Monitoring thousands of devices requires powerful servers and large storage capacity.
- Limited Web Interface: Some advanced settings must be configured via command line.
- Limited Data Analysis: Requires additional tools (Grafana) for advanced analysis.
- Documentation Barrier: While documentation is primarily in English, some localized content may be limited.
Core Components

- Zabbix Server: Central controller that collects, processes, and stores monitoring data and creates alerts.
- Zabbix Agent: Software installed on monitored devices that collects CPU, RAM, storage information and sends it to the Server. Operates in active or passive mode.
- Database: Stores collected data and configuration (MySQL, PostgreSQL, Oracle, SQLite).
- Zabbix Frontend: Web interface for configuring monitoring, viewing data, creating reports, and setting up alerts.
- Zabbix Proxy: Buffer between Server and Agent, reducing Server load in large environments.
- Zabbix API: Programming interface for integration and management automation.
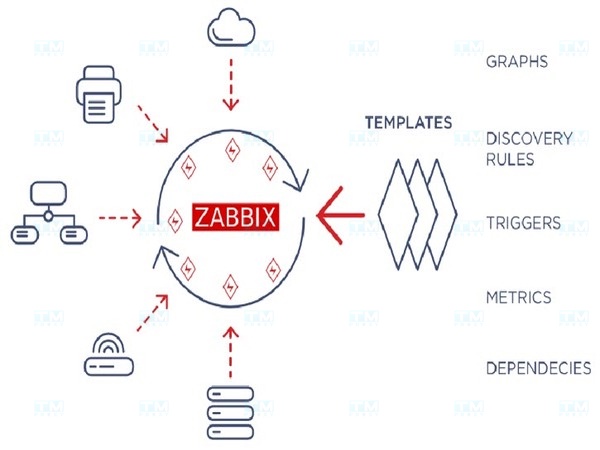
- Templates: Pre-defined templates containing items, triggers, and graphs for quick configuration across multiple devices.
- Items and Triggers: Items are monitored data points (CPU load, RAM usage). Triggers are conditions that activate alerts when thresholds are exceeded.
Hardware Requirements
CPU:
- Small systems (under 1,000 devices): 2-4 CPU cores.
- Medium systems (1,000-10,000 devices): 4-8 CPU cores.
- Enterprise systems (over 10,000 devices): 8+ cores, high clock speed.
RAM:
- Small systems: 2-4GB RAM.
- Medium systems: 8-16GB RAM.
- Large systems: 32GB+ RAM.
Storage: Use SSDs to ensure read/write speed. Small systems need 50-100GB, large systems need 500GB to several TB.
Operating System: Linux (CentOS, Ubuntu, Debian) is recommended. Windows is supported but Linux is more stable.
Database: MySQL, PostgreSQL, Oracle, or SQLite.
Conclusion: Zabbix is a powerful open-source monitoring solution with high customizability, suitable for systems of all sizes. Although it requires configuration expertise, Zabbix delivers great value through comprehensive monitoring and rapid alerting.